CMBI KPI and Performance Reporting solutions
CMBI can develop your KPI and Performance Reporting solutions using a variety of technologies including Excel, Analysis Services, Power BI, and Tableau. We also support the most challenging aspect of the project: the process of defining pragmatic and maintainable KPIs and performance metrics.
Contact CMBI to discuss options for your KPI and performance reporting and read on for more insight into the process of defining a pragmatic and maintainable performance reporting framework.
Defining KPIs
A KPI encapsulates a metric and a target. A call centre might have a target to answer 90% of calls within three minutes. In this case, the metric is percentage of calls answered in less than three minutes and the target is ninety per cent. The KPI reports the variance between the actual value of the metric and the target; this provides a quick way to monitor the health of the business process.
The discipline of creating KPIs is useful in itself. It entails defining relationships between business goals, business processes, and data – vital ingredients of the business intelligence cocktail. The Figure below shows the relationships between the various inputs that we should consider when defining KPIs.
Define the business goal
The business goal is the starting point for defining KPIs. It provides the focus to ensure we are measuring something of value to the organisation. Continuing with the call centre example, the business goal might be to raise customer satisfaction. Having stated the business goal, we can then look at business processes that support the goal. A KPI measures a business process, but the target will be set with reference to the business goal, which is why we need to identify this first. The final step maps the data requirements of the KPI to the data produced by the business process.

Relationships between business goals, business process, and data
In the call centre example the data is the log of calls, the measure is the wait time for each call, and the metric is a calculation of the percentage of calls answered within 3 minutes. In this example, the business process provides all the data we need to monitor the KPI, but we cannot assume this will always be the case.
We now look at each of the steps again relating them to the organisation chart introduced in the article on BI Process Improvement Strategy.
Quantify the objective
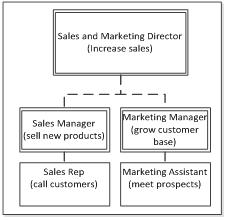
As we stated earlier, the business goals are the starting point for creating a set of KPIs. I have reproduced a section from the organisation chart below showing the business goals (strategic and operational) for the sales and marketing function.

Sales and marketing organisation chart and business goal
| Goal description | Goal target |
|---|---|
Increase Sales |
Increase sales revenue by $1 million from previous year |
Sell new products |
$500K for new product sales |
Grow customer base |
$750K for new customers; $250K growth for existing customers |
Call customers |
Call 500 existing customers about new products |
Meet prospects |
Identify and meet with 100 new target companies |
We want to see traceability of strategic objectives through to operational processes in the organisation. The strategic objective is for a $1 million increase in revenue over the previous year. We expect half to come from sales of new products and half to come from growth in sales of existing products. Seventy-five per cent of the revenue growth across new and existing products will come from new customers, with the other twenty-five per cent coming from growth in existing customers.
Identify data
We need to ensure we are tracking the data necessary to measure the KPIs. The table below maps the goals to the data requirements.
| Goal description | Goal target | Required data |
|---|---|---|
Increase Sales |
Increase sales revenue by $1 million from previous year |
Sales this year; sales previous year |
Sell new products |
Increase new product sales by $500K |
Product release date; sales by product |
Grow customer base |
Sell $750K to new customers; Increase sales to existing customers by $250K |
Customer start date; sales by customer |
Call customers |
Call 500 existing customers about new products |
Log of calls recording product and existing customer |
Meet prospects |
Identify and meet with 100 new target companies |
Log of meetings with company name |
In the current scenario, we will have no problem calculating sales for the current and previous year using existing operational data. However, we may not be capturing phone calls, customer start dates, and meetings, in a structured way. If the business process does not capture the data we need to measure it then we have a missing link in the relationships shown in the Figure above. This will make it difficult to monitor the KPI for the process and we should address the issue as part of the data strategy .
Defining metrics
Having agreed a target and identified the data, we can define the metric used to track the KPI. Generally, you need to include an element of time so that you can track the progress against the KPI throughout the relevant period.
Sale Target Variance % = ((Sales YTD – Sales Previous YTD) - (1,000,000 / 365 * Days elapsed YTD)) / (1,000,000 / 365 * Days elapsed YTD)
Visualising KPIs
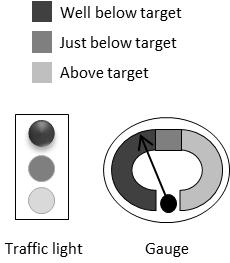
A KPI is often visualised as a traffic light. We define the behaviour of the traffic light display by creating bands as in the following example:
IF Sale Target Variance % >= 0% THEN Green
IF Sale Target Variance % >= -15% THEN Orange
IF Sale Target Variance % < -15% THEN Red
Another alternative is to show the KPI using a gauge with an arrow or line marking the current value of the metric and the bands defined as regions on the display.

Two visualisations of a KPI well below target
Static, dynamic and comparative KPIs
KPIs can be powerful when used in moderation but the process does have shortcomings. Firstly, it is time consuming to agree targets and maintain them. Secondly, if market conditions change we may have to review all the targets once again. Finally, we often lose sight of the original business logic used to create the target. When a KPI is below target, we must first check our rationale for setting the target before deciding what to do about the variance. One solution to these issues is to use a combination of static, dynamic, and comparative KPI targets in the organisation. The following sections define each of these KPI types and explain when it might be appropriate to use them.
Static KPIs
A static KPI has a fixed target that we will not change for the life of the KPI. For instance, a company decides that the revenue target for next year is $100m. The company uses the revenue target to budget costs and strategic projects and so a lot depends on meeting the target. Static KPIs are appropriate for high-level targets because there are not too many to maintain, and we would not adjust them without very careful consideration.
Dynamic KPIs
A dynamic KPI uses a formula to calculate the target at the time we report it. This means that the KPI target can change if the inputs for the formula change. Following on from the previous example, the company may spread the revenue target of $100m across the one hundred retail outlets based on the overall percentage of the revenue contribution for the previous year. Therefore, a retail outlet that generated one per cent of revenue for the company in the previous year would have a target of $1m this year. If there is a change to the $100m target, the retail outlet targets should automatically update.
We should implement dynamic KPIs whenever we have to create a large number of targets based on similar inputs. In our example, the formula may not be appropriate for some retail outlets, but this should not prevent us applying it to the majority. We can always create exception reports whilst benefiting from a more dynamic model. The greater the number of potential targets, the more compelling the need to avoid manual target definitions.
Comparative KPIs
A comparative KPI derives a target by looking at the current performance of comparable entities. Comparative KPIs are very powerful for analysing the performance of highly granular components of the business like individual customers, employees, or products.
Our example company has defined a number of static KPI targets to monitor how quickly their suppliers deliver orders. The problem is that all the suppliers are way behind their targets because they all depend on a group of factories that are having capacity issues. Reporting against the static KPIs becomes meaningless at a supplier level. What the company really wants to know is which suppliers are relatively more efficient given the pervading market conditions. Instead of using static targets, the company defines a comparative KPI target based on the median delivery days of similar supplier orders.
BI in practice
Defining dynamic KPIs
An advertising agency wants to set targets for all its clients. The agency has over one thousand active clients across a range of industry sectors.
The agency does not have time to define a target for each of the clients but does want to track the performance of all clients and report exceptions. They decide the following criteria are important for setting the targets:
Sales for the previous year
Inflation rate
Economic growth rate
Industry growth rate
They define the sales target for the clients as:
Sales target = sales previous year *
(1 + inflation rate +
economic growth rate +
((industry growth rate –
economic growth rate) / 2))
The company records the industry type for each of the clients and uses this to determine an adjustment based on 50% of the difference between the industry growth and standard growth figure. They periodically download the latest growth rates and inflation data from a government website and incorporate the data into the KPI calculation.
Later they decide that they want to adjust the target dynamically based on their own sales growth data. The new target incorporates an adjustment that calculates the average sales growth for the clients in the same industry sector over the last 6 months. This benchmarks each client against the average sales performance of the other clients in the same industry.
We often consider all these factors when defining KPIs but the KPI becomes truly dynamic when we include this business logic in the BI solution so that we do not have to maintain targets manually.
As well as reducing maintenance, the method increases transparency of the targets. Exposing the business logic, makes it easier for people not involved in setting the targets to interpret the results.
