
Customer Demographics and Location Analysis | Challenges
Understanding customer behaviour by location and demographic requires more than just a list of customer addresses and attributes. There are numerous challenges and requirements including:
- Cleansing and geo-coding customer or supplier address data
- Integrating geospatial reference data for mapping regions, sales territories or suburbs of interest
- Software to visualise maps and analytical data
- Demographic statistics for locations to understand significance of customer segments
CMBI's experienced team have worked with these challenges for many years and offer efficient and cost effective solutions to bring your customer data to life.
We integrate industry leading software, comprehensive address geo-coding data sets, ABS Census databases, geospatial data sets, and your data to create insightful reports and analysis.
Types of analysis and visualisations
CMBI provide various types of geospatial and demographic analysis. Common requirements include
- Market penetration: what percentage of my target demographic are my customers
- Customer location: customer location and other attributes on a map
- Customer activity: sales, units, displayed as points on a map or heat map regions
- Distance analysis: how far do my customers travel for my services. How far do I have to travel to my customers
Frequently Asked Questions
Do I need to buy data sets or expensive software?
No. We use open public data sets and inexpensive commodity software. CMBI's service and value is to simplify these - sometimes complex - data assets and integrate them with your customer data.
Australia is a big place. How do you map my Australia wide customer base without losing detail?
We recommend visualising data at various regional layers. For instance, by State, by each of the major metropolitan areas, and by each of the regional areas. We have some provided some screenshot examples below.
How do you deal with incomplete or messy address data?
We map your address data to a master list of geo-coded Australian addresses and use various pattern matching algorithms to enhance incomplete data.
Do I have to pay support or ongoing subscriptions for this service?
No. We build the solution and hand over all data and software assets at the end of the engagement. You own the output and can extend and amend as required.
I don't have inhouse expertise. What about future support and development?
Our clients benefit from our flexible model that allows them to procure remote or onsite support by the hour on a time and materials basis.
CMBI Mapping Examples
CMBI have developed a number of example mapping solutions using various geospatial and demographic data assets. We will be happy to provide further examples or demonstrations on request

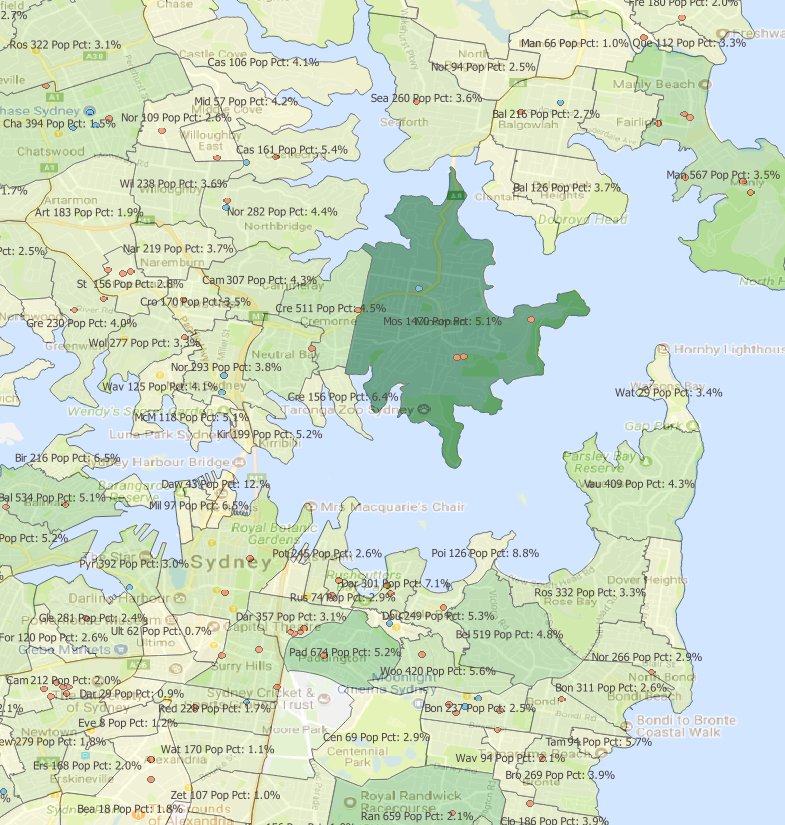
Sydney suburb boundary heat map showing ABS Census 2016 population [SQL Server Reporting Services]
We can create customised heatmaps for any metro or regional area of Australia. We can use your brand colours and customise labels and measures.
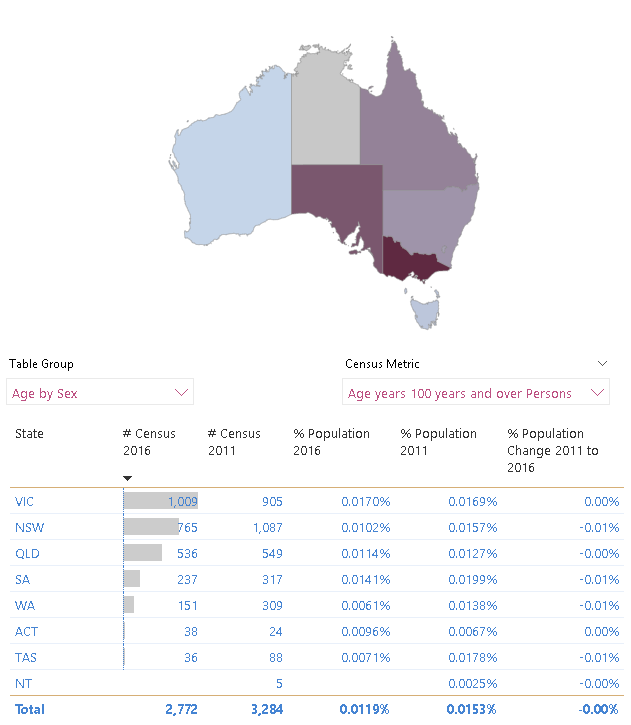
ABS Census 2016 showing persons population 100+ years old [Power BI]
A State map is often a good start point and can provide drilldown reporting to more detailed intra-State regions.
ABS Census 2016 showing women earning > 3000 AUD per week and the proximity of hospitals (red) and shopping centres (blue) [QGIS]
See your data overlayed your precise target demographic and include points of interest like public amenities or infrastructure.
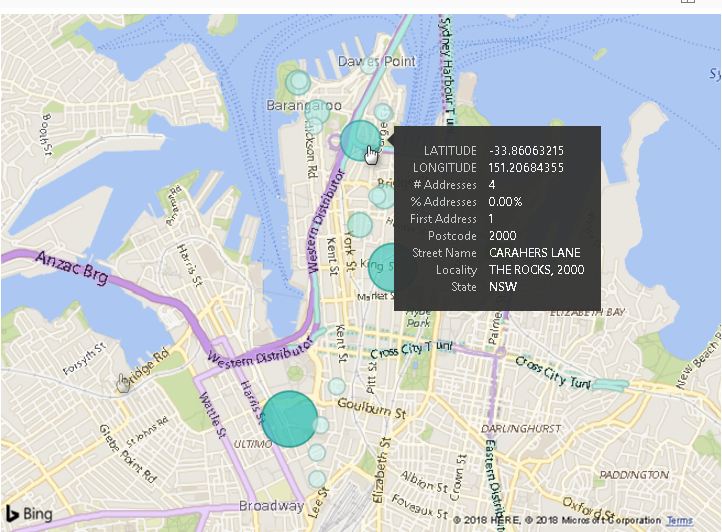
Display the precise location of individual addresses [Power BI]
We geocode all your Australian addresses and display them on a map using dots, bubbles, or other customised markers.