Download the sample Power BI model
CMBI have developed this Australian Federal Election Power BI model using Power BI Desktop which is FREE from Microsoft.
Download this refreshable Power BI model of the 2019 Australian Federal Election and learn Power BI while keeping track of the latest election result updates
Introduction to Australian Federal Election 2019 Power BI Model
The Federal Election 2019 Power BI Model (PBIX) Power BI model imports various data sets from the Australian Electoral Commission (AEC) website. The AEC update these data sets throughout the day as electoral divisions are declared. When we Refresh the Power BI model we get the latest data published by the AEC.
Election results
The model imports data for the House of Representatives (lower house). MPs in the House of Representatives represent a Division. A candidate becomes an MP if they win the vote for that Division. For a quick explanation of how the AEC determine the Division winner, see https://www.aec.gov.au/voting/counting/hor_count.htm
Using the model
CMBI provide this model as an engaging Power BI sample using real-world data. We have performed basic unit testing of the data but we do not intend this to be a source of reference for those interested in electoral statistics. If your primary interest is electoral statistics then please visit https://tallyroom.aec.gov.au/HouseDefault-24310.htm to validate any insights you gain from this model.
Power BI Sample Features
The Federal Election 2019 Power BI Model Power BI model demonstrates a number of useful Power BI features.
We will briefly outline some of highlights in the sections below.
Visualisation features
- Custom Tooltips
- Drillthrough
- Slicers
- Conditional formatting
- Shape Map
Model features
- Calculated columns - DAX
- Measures - DAX
- Data model
Power Query features
- Refreshing the model
- Privacy setting (to avoid issues refreshing the model)
- Power Query custom functions
Visualisations features
Custom tooltips
When you hover over a row in the Division tab table you should see a pop up graph showing the results by Candidate for that Division.
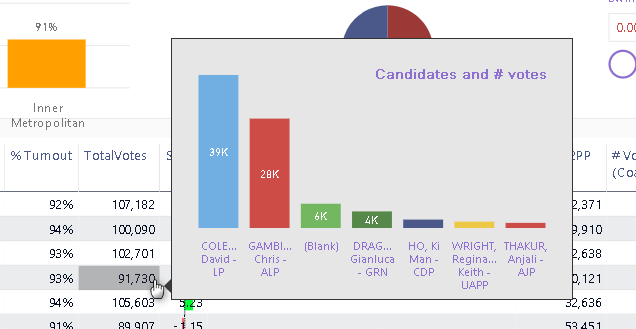
Custom tooltips report pages that you can configure to appear as a pop up report
We define the Custom Tooltip in the Candidates tab and set it in the Tooltip option of the Table visualisation.
Drillthrough reports
We can drillthrough from the table in the Division to various sub reports.
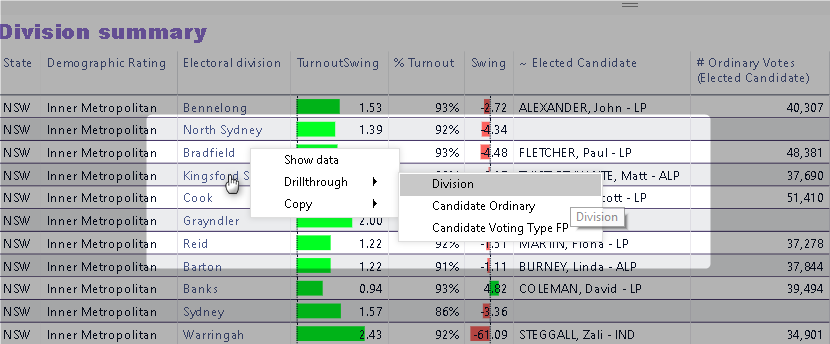
Drillthrough report allow you to see more detail about a particular row
Right click on the row and navigate the sub menus to choose a Drillthrough report. It is a simple process to set up a Drillthrough report.
Slicers
We have added a couple of regular Slicers and a Numeric Range Slicer for the Swing. Use these to filter the results on each of the tabs.

Slicer types include checkboxes, dropdowns, and numeric range
Conditional formatting
The tables throughout the model make extensive use of conditional formatting. It is a great way to add a visual element to a table in a compact space.

Conditional formatting can apply to any column/field in a table
The tables throughout the model make extensive use of conditional formatting. It is a great way to add a visual element to a table in a compact space.
Conditional formatting in this model includes
- Background colour
- Font colour
- Data bars
You can set conditional formatting independently for each column/field in the Power BI table.
Shape map
The shape map requires a couple of steps to work correctly. Power BI by default only includes shape map boundaries for Australian States, not suburbs, electoral divisions or other more granular political boundaries.
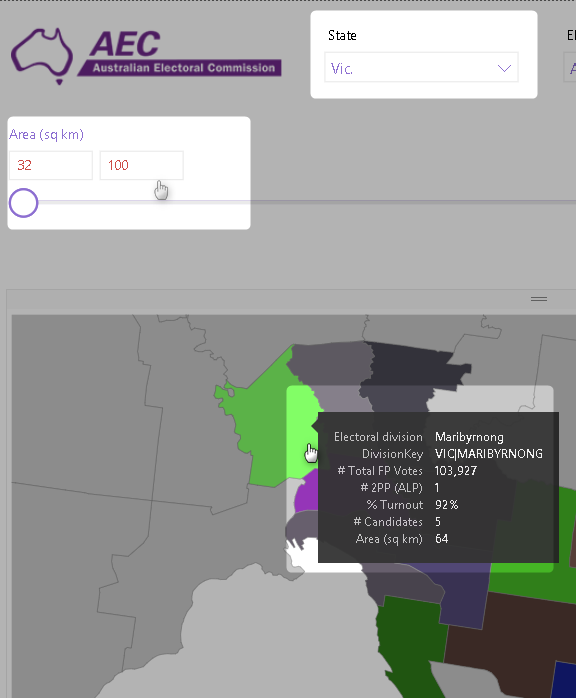
Shape Maps need a TopoJSON file to define the boundaries
To create an effective Australian Shape Map in Power BI you often need to get a Shape file from a government website and then convert that Shape File to a TopoJSON format using Map Shaper or similar service. You then import the JSON file into the Power BI model.
In this shape map, we also include numeric slicer for Swing and Division area.
Model Features
Calculated columns – DAX
We augment the basic data model with calculated columns that we can then use in Slicers or further DAX measures. The Candidate table has a couple of calculated columns that show the Candidate rank within their Division.

Calculated columns can extend the model with simple or more complex derived data
Candidate Ord Vote Rank = RANKX(FILTER(ALL(Candidates),Candidates[DivisionID]=EARLIER(Candidates[DivisionID])),[# Ordinary Votes])
The Candidate Ord Vote Rank column calculates the rank by number of ordinary votes.
Measures - DAX
The model includes various DAX measures to provide further insight. You can inspect the measure formulae by selecting a measure in the FIELDS pane and
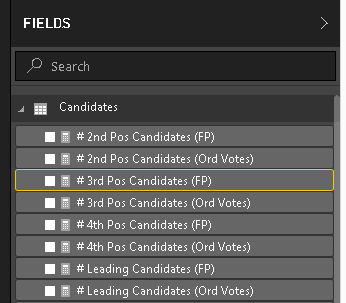
The model has some simple and more complex DAX calculations
# 3rd Pos Candidates (FP) = COUNTROWS(FILTER(Candidates,Candidates[Candidate FP Vote Rank]=3))
Data model
The data model defines the relationships between the individual data imports.
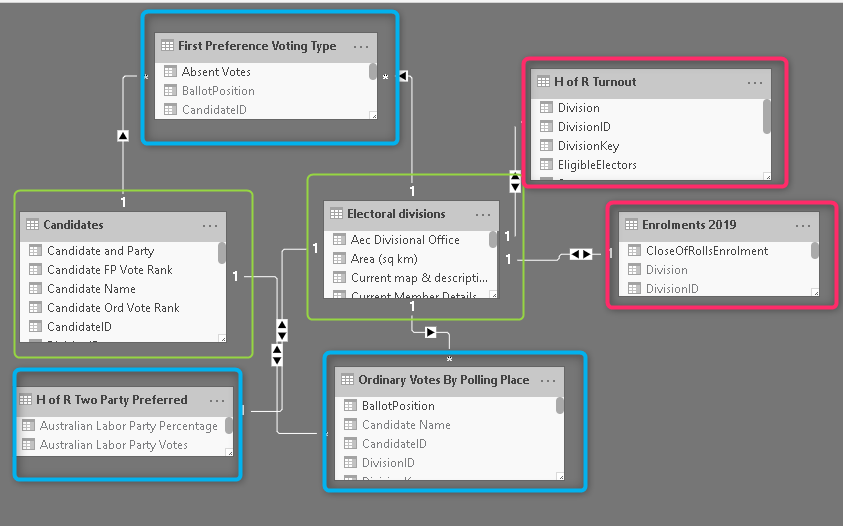
View and define relationships between the imported tables
The data model view shows the links between the various AEC data sets.
- Green highlighted reference tables (Electoral Division, Candidates)
- Blue highlighted data tables that link to both reference tables
- Red highlighted data tables that link to just the Electoral Division
Power Query Features
We can refresh the model to get the latest data from the AEC. The model uses a number of relatively simple and more complex data import routines.
Refreshing the Power BI data
We refresh the model with the following steps
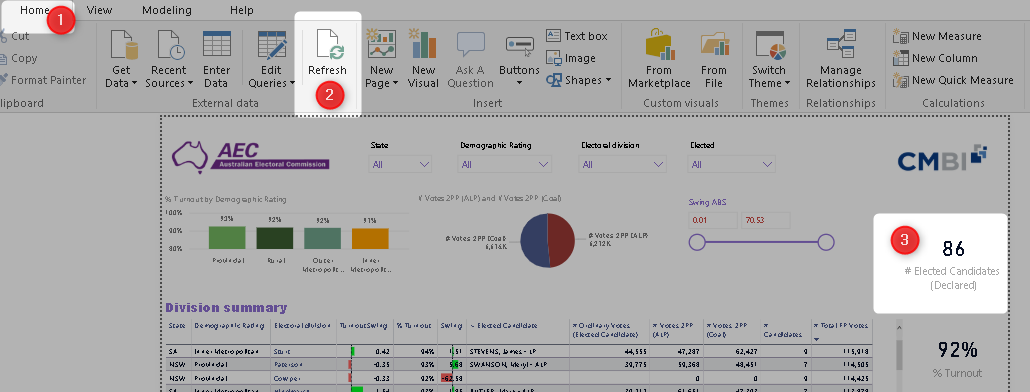
Update the Federal Election results by Refreshing the data model
1. Navigate to Home tab
2. Press Refresh
3. Watch the # Elected Candidates (Declared) : it may update as more Divisions are declared
Privacy settings
If you get errors on the refresh, it may be for two reasons
1. Internet or firewall issues with your location/PC
2. Privacy settings on the workbook (which you can easily fix)
Fixing privacy setting
This model uses Public data so we have no issues ignoring Privacy setting (which can cause refresh issues on more complex Power Query).
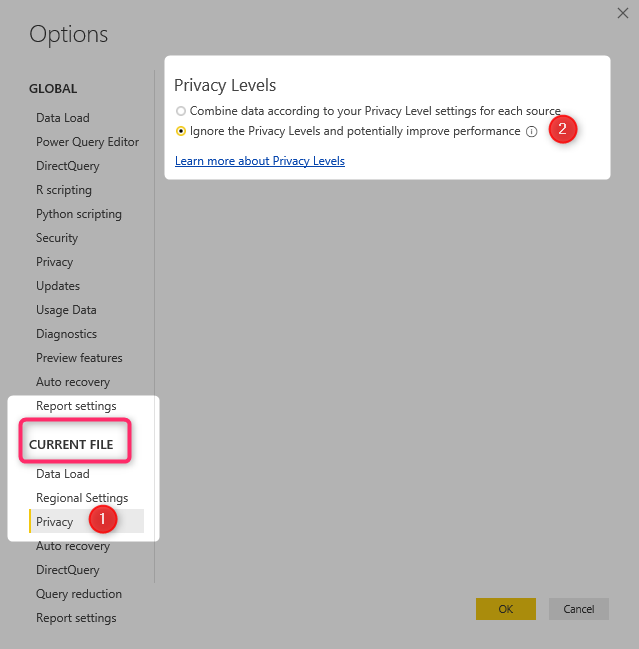
Ignore Privacy settings is the quickest way to resolve data combination issues on public data
Select Options and settings in the Power BI File Menu. Then
1. Select Privacy option in CURRENT FILE section
2. Select Ignore the Privacy Levels…
Power Query custom functions
The model uses two custom functions. These are invaluable where you have many individual files, web pages, or other discrete data sources that you need to merge into a single data set.
Opening the Power Query window
The view and edit Power Query queries we open the Power Query window
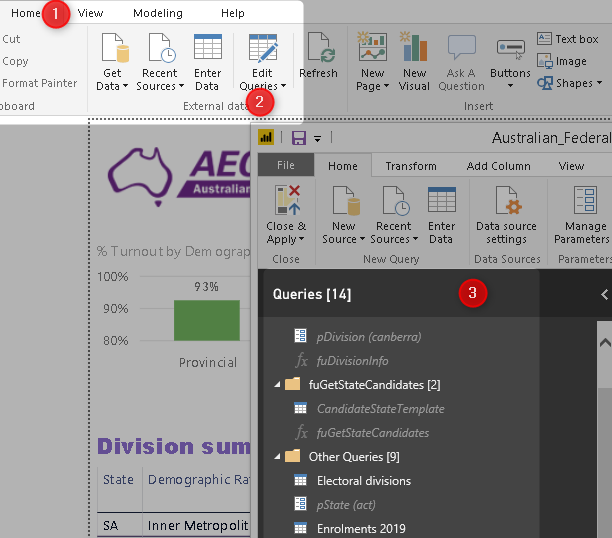
View or edit Power Query queries in the Edit Queries window
1. Home tab on the Power BI ribbon
2. Edit Queries
Power Query custom function
We have two Power Query custom functions in the model. To inspect how they are used follow the steps below.
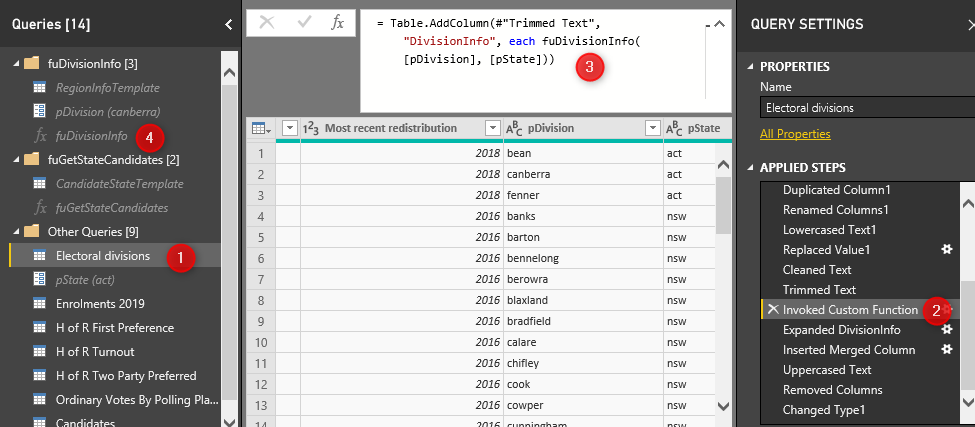
Power Query functions are very useful for loading multiple similar files or webpages
1. Click on the Electoral Divisions Power Query (left queries pane)
2. Click on the Insert Custom function step (right Applied Steps pane)
3. View the formula bar to see the Custom function we are using in this step
4. Select the fuDivisionInfo or RegionInfoTemplate to learn more about the steps in the custom function
Want to learn more about Power Pivot?
CMBI provide a comprehensive set of Power Pivot and Power BI Training courses for all levels of Power Pivot users and developers. Please contact julie@cmbi.com.au or visit our Training Home Page
Plan your training program
Download and share CMBI's full Power BI Course Offering Guide from here.
About CMBI
CMBI designs and develops business intelligence and analytics solutions for clients in Sydney and regional NSW. CMBI technology expertise includes Power BI, Power Pivot, Excel, SQL Server, Analysis Services, SharePoint BI, and Tableau
